.svg)
Tools and Objects
Geometra comes with a wide range of tools and objects designed to make measuring fast and accurate. In this article, you'll learn what each tool does and how to use them to build your bill of quantities.
Overview of Tools
Every tool in Geometra is used to create objects — measurements or markups placed directly on your drawings. An object can represent a room, a wall, a door, or any other element you measure or count.
Move, Edit, Copy, Paste, and Duplicate
Select any object to move or edit it — drag the points that appear on the object to adjust its shape. You can copy and paste objects between different files and pages within your project, which is especially useful for repetitive elements like apartments or terraced houses. On the same page, you can also duplicate an object and place the copy anywhere.
Lines, Areas, and Reductions
To add a point to a line or area, use Alt + Click on the segment between two existing points. To remove a point, use Alt + Shift + Click on the point you want to delete. While placing points, you can undo the last placed point with Ctrl + Z.
Objects with Net Values
For objects that display net values, you can enter formulas directly on those values to modify them. This is useful when measuring a roof — you can apply an angle formula such as /cos(25) to automatically calculate the actual roof surface area. To enter a formula on a net value, double-click the value in the property panel.
Interval Placement
Place points at regular intervals along lines, areas, reductions, and single lines within an area measurement. This is ideal for measuring fences, fixings, gutter hooks, prefabricated walls, and similar repetitive elements. Use the shortcut Ctrl + Alt + Click on the area where you want to place the intervals. Manual adjustment of the last point may be needed if the measurements don't divide evenly.

Add Perimeter Inside or Outside an Area
When you draw an area — for example a concrete floor — you can add a perimeter zone outside or inside it, including depth and height. This is useful for construction work where you need to account for edges or borders. The perimeter is calculated along the sides, which means there will be a small surplus at each corner. Works with areas, reductions, and ellipses. See video below.

Predefined Objects on Areas, Lines, Circles
Enter your measurements, select a tool, and click to place a predefined object directly on the drawing.
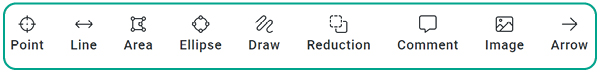
Point
The point tool is used to count objects on drawings — for example doors, windows, or fixtures. Points can also be used to highlight a detail or add a note to the drawing. Choose from five icons: Rectangle, Pin, Star, Fan, or Exclamation mark. You can also customize color, transparency, size, and rotation.
Line
The line tool gives you two dimensions to work with: lengths and walls. Values are calculated based on the page scale, and wall surface area is calculated using the specified height. Keep placing points until you've measured everything you need, then right-click to finish. You can also calculate tiles for line surfaces, and use an angle setting to get the actual length of sloped elements such as roof edges or bargeboards. Customize color, transparency, thickness, style, and start/end symbols in the properties panel.
Section Heights on Lines
Use section heights when different parts of a line have different heights — for example along a wall with windows and doors.

Area
The area tool gives you the most values to work with: gross and net values, as well as outer dimensions. If you've placed one or more reductions on an area, you'll also get the total reduced value to use in your rows. Reductions automatically affect the net values of the area. To mark a rectangular shape, place the first point and right-click diagonally to create a precise rectangle. For irregular shapes, place a point at each corner and right-click to finish. You can calculate tiles for both net area and net wall, and customize fill color, transparency, border color, thickness, and style.
Lock Aspect Ratio for Area Measurements
Lock the aspect ratio of an area measurement to scale it proportionally. Drag the corners to increase or decrease the size while keeping the shape intact.
Cloud Markup on Area (Standard)
Use the cloud markup to visually indicate areas on the drawing that require action or attention.
Ellipse
To place an ellipse, click and drag to define its size. Hold Shift while dragging to create a perfect circle instead. The ellipse is created when you release the mouse button. In addition to standard gross and net values, the ellipse also returns diameter and radius in both X and Y directions. You can calculate tiles for net area and net wall, and customize fill color, transparency, border color, thickness, and style.
Draw
Hold down the left mouse button and drag to draw freehand. Release the mouse button to create the drawn object. Freehand drawing is especially useful when measuring areas on maps with contour lines. You can calculate tiles for net area and net wall, and customize fill, border, and aspect ratio settings in the properties panel.
Reduction
Reductions are used to subtract areas from a main measurement. An area can have multiple reductions, each of which reduces the total values of the main object. Reductions appear under their respective area in the estimate tree. Use reductions to subtract windows and doors from a facade, for example, to get the actual surface area. The sum of all reduction values is shown under the variables RA, RL, RVO, and RV. You can calculate tiles for both net area and net wall, and customize fill and border settings.
Comment
Text comments let you describe or highlight information directly on the drawing. Click and drag to place a comment box, then release to create it. Drag the corner points to resize the text. In the properties panel, you can adjust font, text style, color, background color, and border to make comments clearly visible on the drawing.
Image
Click the image tool, then click anywhere on the drawing to open a file picker. Select a JPEG or PNG image to upload. Images are currently limited to 512 KB. Once uploaded, you can resize and reposition the image on the page. The aspect ratio lock is enabled by default and can be toggled in the properties panel.
Arrow
Use arrows to create clear visual connections between comments and objects on the drawing. Arrows are purely visual guides and do not produce any measurement values. Click and drag to place an arrow, then adjust its appearance in the properties panel.
Text Highlight
The highlight tool lets you mark up and emphasize information directly on a measurement or in estimate rows. Highlights are visible in the estimate tree.
Measurement Values
For object types that return measurement values, these are organized by category in the properties panel. You can collapse categories you don't need. Most measurement values have a variable prefix that you can use to link the value to a row in your estimate.
Labels
Labels let you display measurement data — such as area or wall surface — directly on the drawing, so you can instantly see key values without opening the properties panel. Labels appear at the center of an object or along its edges. Choose which labels to show from the list, then adjust placement, text color, appearance, and background to make them easy to read on the drawing.
Markers
Markers are visible only when an object is selected. They display numbers along each segment, showing which measurement variable corresponds to that segment — for example, markers with the value 1 indicate that variables L1 and V1 refer to that segment. Markers also show the angle at each point, making it easy to identify the degree of the angle between two lines.
.svg)